Measuring flow rate with a river model
Summary
This lesson guides students through the process of constructing their own river model to explore water flow and dynamics. They will also measure and calculate the flow rate of a stream or river using simple tools and methods.
All of our lessons are designed with two parts — an in-classroom and a field component. You can choose to do the lessons in succession over multiple days, at a convenient time, or teach either part as a standalone lesson. The activities are presented as small group activities to facilitate collaboration and active participation. At the bottom of the page, you will find a section on ocean and real-world connections and a glossary of terms.
Recommended grades
These activities are recommended for grades 7 to 9.
Learning outcomes
- Construct a model of a river using everyday materials.
- Experiment with gravity and objects to change water flow.
- Measure and calculate the flow rate of a local water body.
- Discuss how water flow can be influenced by natural and human-made structures.
Background
What is stream flow?
Flow indicates the amount of flowing surface water measured at a particular point. Rates are affected by the width/depth of the water body and are often influenced by man-made structures (e.g., bridges, culverts, dams) or natural features (vegetation, tree stumps, waterfalls). The flow of rivers, streams, and creeks is driven by gravity and describes water movement from higher to lower elevations.
Why is stream flow important?
A body of water that flows quickly will have different characteristics than a still one, like a pond. Fast-flowing water can transfer nutrients and pollutants downstream to new places. Understanding stream flow gives us valuable insights into freshwater sources, hydrological cycles, ecosystem health, and management decisions related to water resource allocation and conservation efforts.
What do the measurements mean?
Stream flow measurements offer significant information about water availability and flow dynamics. A lack of water flow may mean that the area is dependent on seasonal rainfall, or that there has been a human intervention like a dam. Year-round flows suggest that underground sources or surface inflows could be contributing to the stream, while seasonal variations may be from natural factors or human-made controls.
Did you know?
In 1992, a cargo ship spill of 29,000 plastic bath toys led to the mapping of ocean currents. These “friendly floaties” helped scientists model water dynamics in ocean currents.
Build a river model
Location: In the classroom
Duration: 60 minutes
Objective: Students will construct their own river model and explore flow rate using different materials.
Groups: We recommend groups of maximum 5 students for this activity.
Materials needed
- Shoe boxes or other long cardboard box
- Sand
- Small rocks like gravel and pebbles
- Sticks, twigs, leaves
- Toilet and paper towel rolls
- Aluminum foil
- Tape
- Shovels/scoopers
- Water pitcher or bottle
- Small bead or marble that floats
- Books
- Towels and table cloths
- Stopwatch
- Small bowl for water collection
- Scissors
- Blue food colouring
Preparation
- Divide students into their groups before the day of the activity.
- Encourage students to brainstorm and bring materials from home to use as obstacles and landscape features. They can be creative with items they bring like rice, grains, Lego®, or blocks!
- This activity could get messy! Set up the working stations by placing table cloths to capture water seepage and having towels nearby in case of spills.
- Have a snap blade knife available for cutting the drainage holes in the box if needed. Students should use this tool with adult supervision.
- Have aluminum foil available for lining the channel and add two drops of blue dye to each student’s water bottle.
- You can have a large bag of sand/soil and scoopers for students to add sand to their boxes. Or you can travel to each group and scoop sand into their boxes.
Each group should have:
- A water bottle with dyed blue water.
- Small rocks and twigs for their dam.
- At least two shoeboxes or a long box.
- Several rolls of toilet paper.
- Scissors
- Tape
Steps
Set up the riverbed
Teacher tip!
Students may struggle to construct their foundation. Encourage them to help one another and share strategies on creating the shape for their riverbed.
- Students should open up and tape together their shoeboxes to create a longer riverbed.
- Fill the container with sand to create the riverbed.
- Add gravel or small rocks to the riverbed to create an uneven terrain.
- At the end of the riverbed, cut out a hole in the shoe box that the water will flow out of. Have a bowl nearby to collect the water.
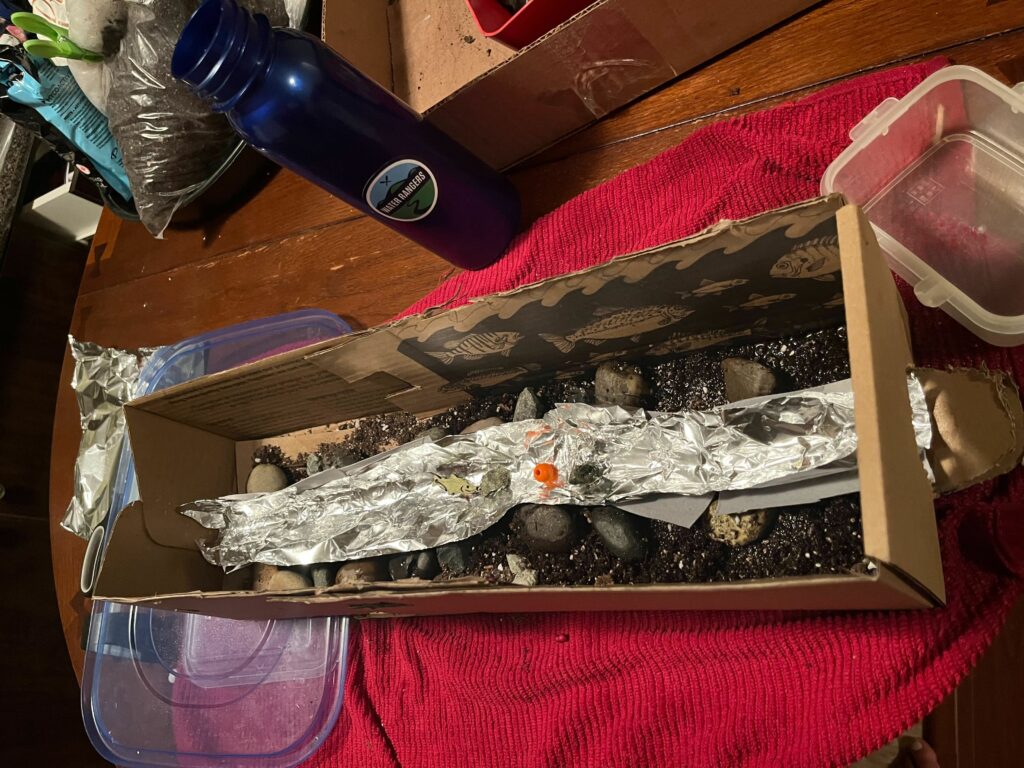
Create the water channel
- Cut the toilet and paper towel rolls vertically in half to form the water channel.
- Use the rolls to create a path from the beginning to the end of the riverbed. Get creative with how you want your water to flow!
- Line the channel with aluminum foil and tape everything together to enhance water flow and prevent leakage.
- Place small rocks in the channel to represent obstacles.
Human-made structures like ditches, canals and culverts alter water flow patterns similarly to the toilet paper rolls. They redirect water that falls directly onto the ground and capture stormwater.
Observe water flow
- Pour water gently into the channel and observe how it flows around obstacles.
- Place a bead at the start of the channel and record the time it takes to reach the end.
- Record observations, including instances where the bead remains stationary.
Experiment with incline
- Adjust the incline of the channel by placing a book under the starting point.
- Repeat the bead test and record any changes in flow dynamics due to the incline adjustment.
In natural river systems, the slope of the land directs water flow, mimicking how changing the incline in our model affects water movement. This relates to the concept of drainage basins where water naturally flows downhill.
Suggestions for enrichment
Once students have constructed a solid model and determined an incline where water flows to the end of the channel, they can use the bead test to calculate flow velocity, discharge, and the cross sectional area. Check out the glossary for the definitions of these terms.
- Measure (cm) the length, width, and depth of your channel.
- Release the bead at the upstream mark and time (s) how long it takes to reach the end of the channel.
- Repeat 3 times and average.
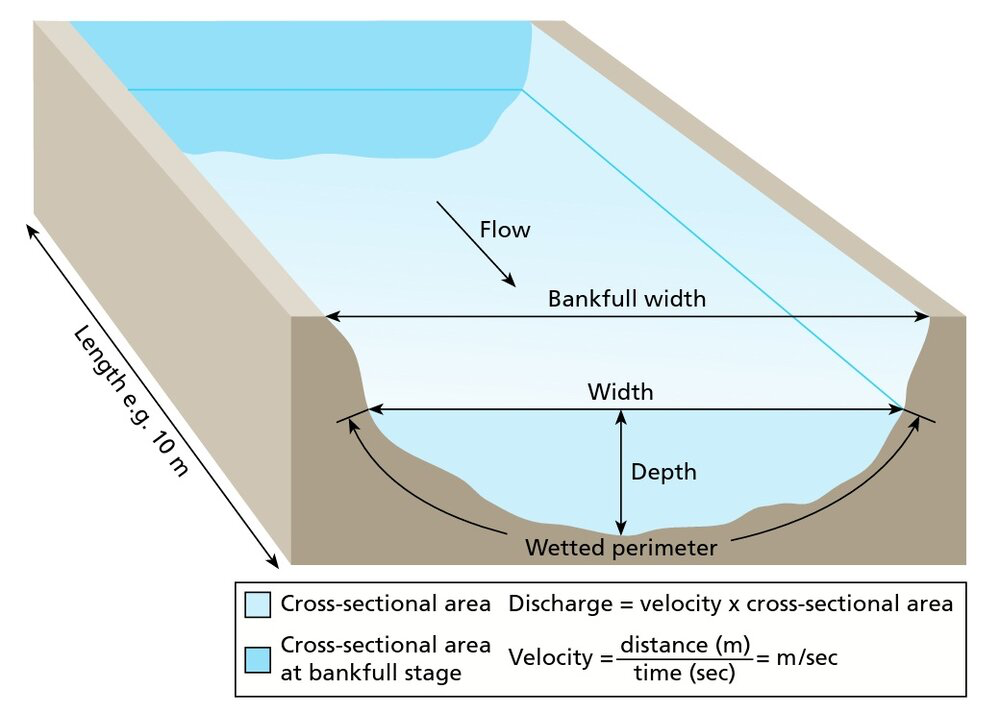
- Cross sectional area = width x depth
- Surface flow rate (flow velocity) = v = length ÷ time
- Discharge = low rate x cross section
Build a dam
- Construct a dam using sticks, twigs, and leaves in the channel.
- Pour more water into the channel and observe the effectiveness of the dam in controlling the flow.
Dams can be made by nature or humans. Beavers use mud and sticks to strengthen their dams and create beaver ponds where they are safe from predators. Human-made dams are important for holding reservoirs to provide water for domestic and industry reasons, but can alter the habitat of natural rivers.
Discussion questions
- How did the obstacles in the channel impact water flow? What are some obstacles to water flow that are present in real rivers?
- How did changing the incline of the channel affect water flow speed and direction? What does this tell us about natural water courses?
- Did your channel have any leakage? How would leaking human-made channels affect natural ecosystems?
- How did the volume of water you poured impact the flow rate? What could this tell us about the presence of water in natural settings, such as weather patterns and waterfalls?
- What can we learn from the differences between human-made and natural water channels and barriers in terms of environmental impact and sustainability?
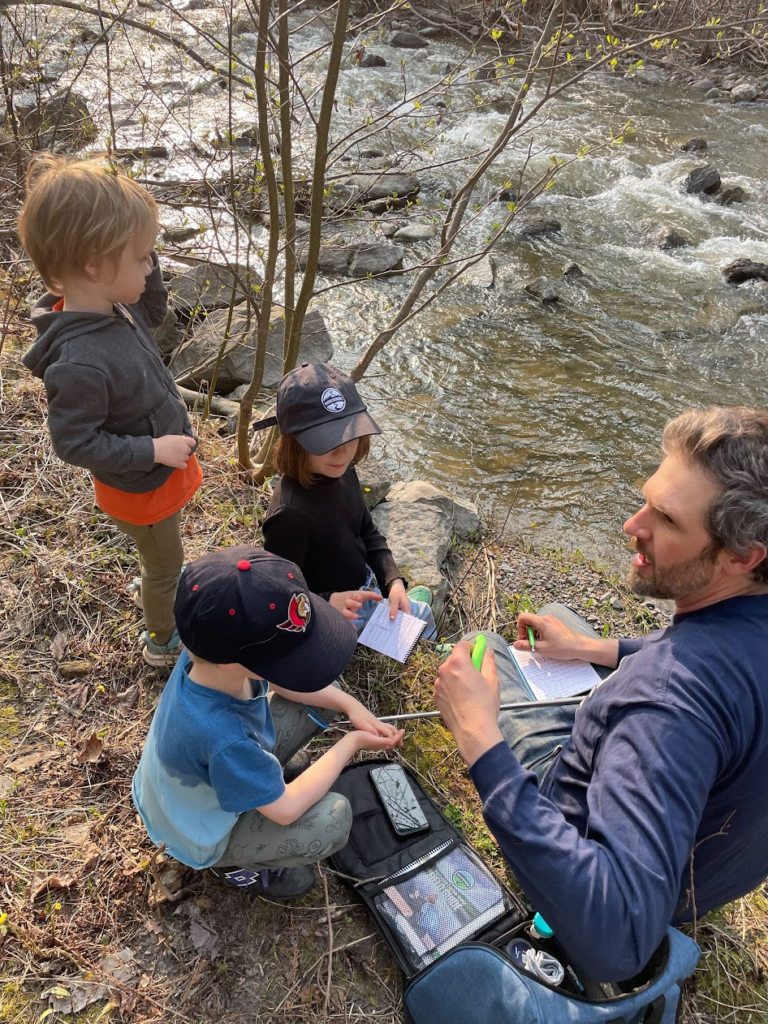
Calculate flow rate at a local water body
Location: In the field at a site with flowing water like a creek, stream or river.
Duration: 30 minutes
Objective: Measure and calculate the flow rate of a local water body.
Groups: We recommend groups of 4-5 for this activity.
Materials needed
- Measuring tape
- Calculator
- Timer
- Buoyant object
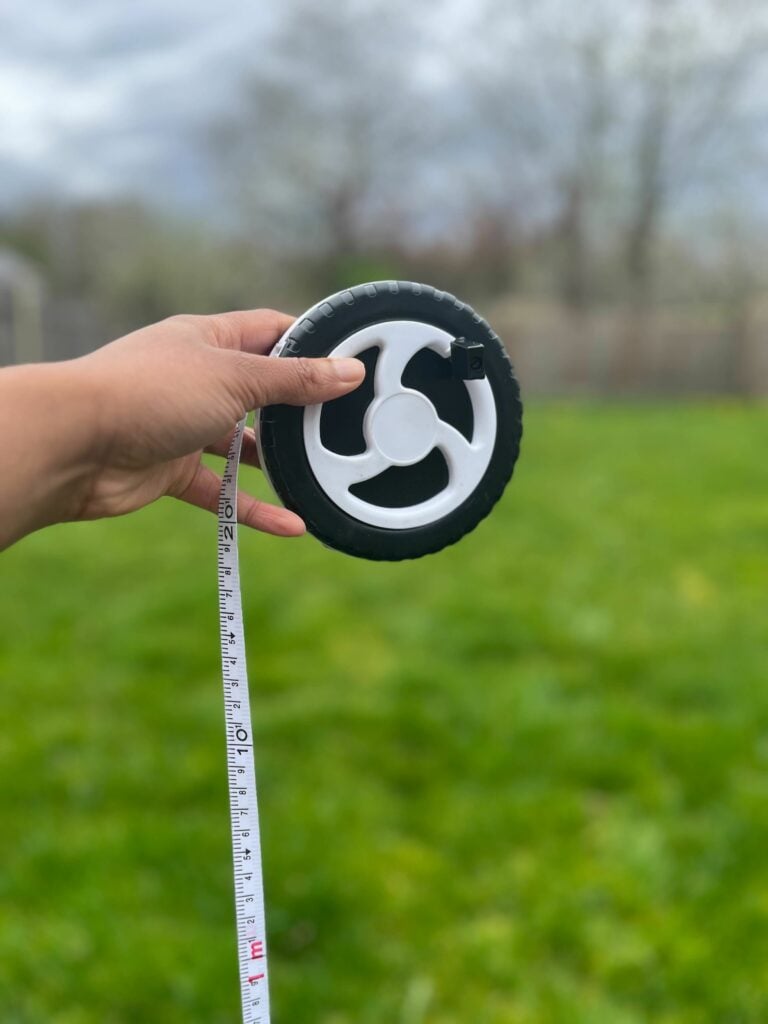
- Reel/tape measure
- Pens
- Notepad
Do you have your Education testkit?
All materials for outdoor activities can be found in the Water Rangers education testkit.
Education testkitThis activity involves testing at a creek, stream or river. Always refer to the safety tips in your educator’s guide, as well as our testing location guide and general tips for choosing a sample location when testing outdoors. If you do not have access to flowing water, you can use your kit to test for the rest of the water parameters with your class at your local water body.
Steps
Observations
- Share information about the waterbody where you are located. Ask students if they know any facts or what they would like to discover during the testing.
- Encourage learners to observe their surroundings.
- What do they see/notice?
- What sounds do they hear?
- What do they smell from where they stand/sit?
- Note any sources that could influence the flow rate of the water body, such as natural features or man-made structures.
- Encourage students to ask questions and make initial observations about the environment.
Measuring water flow
- Identify a safe spot for students to access the water.
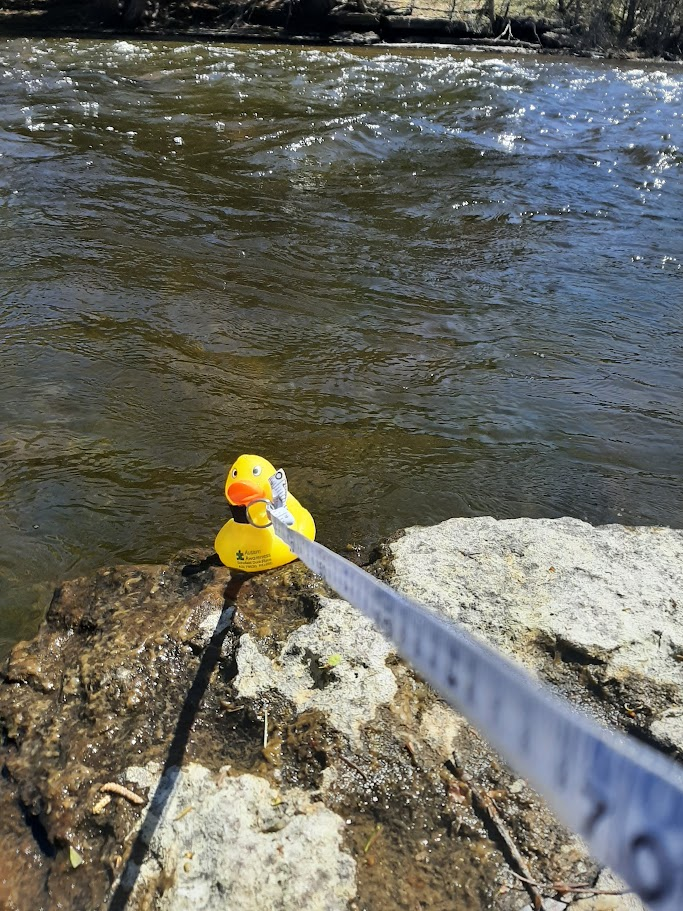
- Measure 10 m of the stream using the reel or measuring tape.
- Students can be grouped into pairs, where one person is assigned upstream with the buoyant object, while another person stands downstream with a stopwatch.
- Simultaneously start the stopwatch and release the object to flow downstream.
- Record the time it takes for the object to travel to the 10m point downstream.
- Repeat the process at least 3 times to calculate the average velocity.
Calculating water flow
The formula to work with is:
Surface flow rate (v) = Length (m) ÷ Time (s)
Discussion questions
- Where do you think this water is flowing from, and where is it flowing to?
- What can happen when water flows from one place to another?
- Pollution
- Plants/animals move
- Current stirs up solids
- Stretch task: find out how many centimeters per second (cm/s) your object travels.
Ocean connections
Ocean currents
Rivers flow because of gravity, while ocean currents are driven by various factors. Differences in salinity and temperature cause vertical movements: denser water sinks, while less dense water rises. Meanwhile, horizontal movements are influenced by wind and the Earth’s rotation. Wind generates surface currents, while the Earth’s rotation causes deflection, forming circular patterns known as gyres. Ocean currents resemble vast rivers, following predictable paths. They can flow at the surface or deep within water, covering short distances or spanning entire ocean basins, even encircling the globe.
Real world connections
Beavers are known as nature’s engineers because of the important role they play in maintaining healthy ecosystems. Unlike human-made dams, which often disrupt ecosystems, beaver dams create wetlands, fostering biodiversity by providing habitat for numerous species. They also enhance water quality by reducing soil erosion, retaining sediment, and filtering pollutants like heavy metals and pesticides. Inspired by the positive impact of beaver dams, conservationists and engineers are turning to these natural models to mitigate the effects of drought and climate change through the implementation of beaver dam analogues. Read 5 ways beavers keep our ecosystems healthy.
Learn more about how beavers are helping to address drought in British ColumbiaGlossary
Bridge: A structure that helps you cross over things like water, valleys, or roads.
Channel: A long groove made by flowing water where a river flows.
Cross-sectional area: The width of the river multiplied by the average depth.
Culvert: A structure that lets water flow underneath roads, railways, or trails.
Dam: A barrier in a river to control water flow or make a lake.
Discharge: The amount of water that moves through a stream or river.
Reservoir: A big natural or artificial lake where water is stored.
River: A large natural stream of water flowing in a channel to the sea, a lake, or another river.
Stream: A small, narrow river or a continuous flow of water in a natural channel.
Velocity: How we describe how fast water is flowing, usually in metres per second.
Volume: The space something takes up or how much a container can hold, measured in cubic units.
Water dynamics: The study of how water moves and is distributed on Earth, including in the air, on land, and in oceans.