Qualitative Data
Adding context to your observations is essential, as important water quality information isn’t always captured in numbers alone. Describing the location based on visual indicators is useful to determine the health of the water body. Taking pictures to support your observations is also incredibly helpful in water quality assessments.
On the surface
Is there anything on the surface of the water? Is there yellow pollen, natural debris, foam, or scum? What’s on the water’s surface can signify events happening in the surrounding environment. This gives us a bigger picture of ecosystem functions.
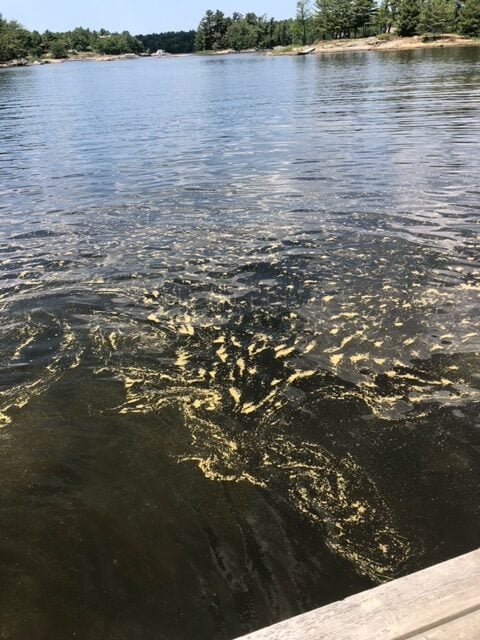
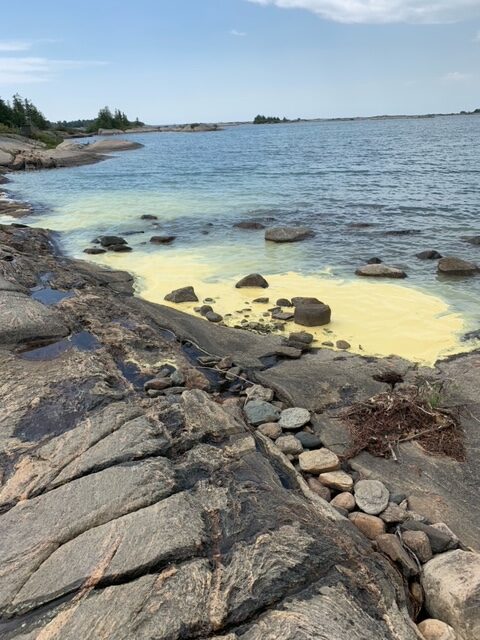
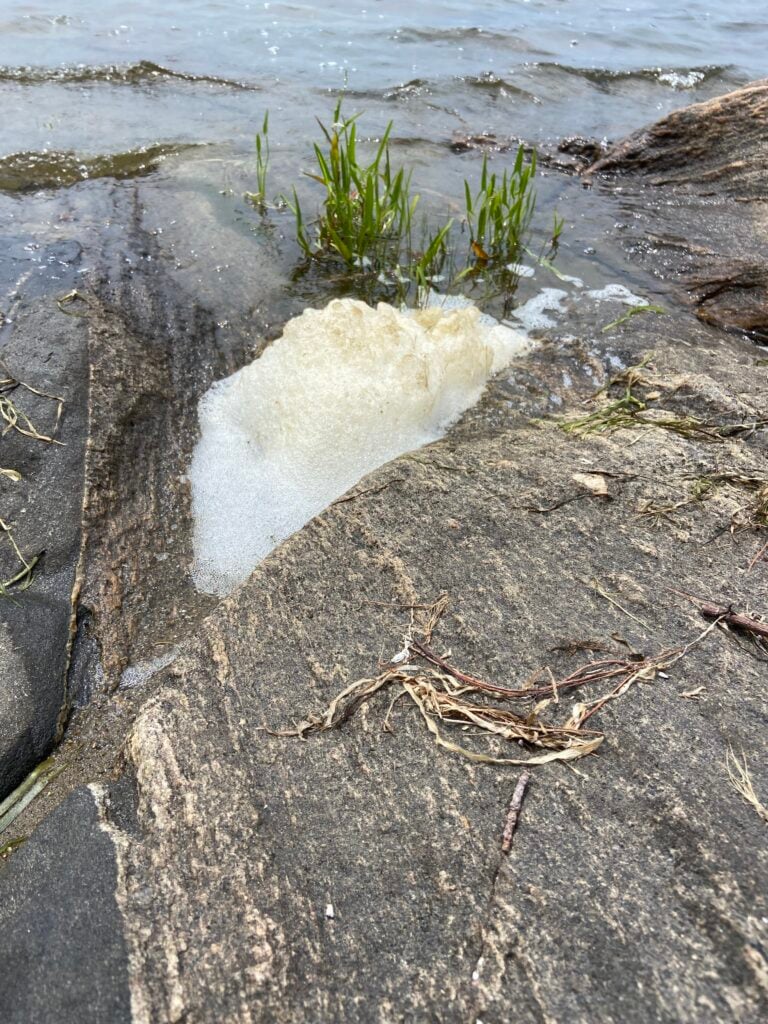
Observe the surface of the water and take notes to include with your qualitative observations.
Pollution sources
There may be sources of pollution in the surrounding area that will impact water quality readings. Residential, industrial, and urban/road discharge can run off into nearby waterways and have huge impacts on water quality.Road salts and treated water (containing chlorine) can negatively affect aquatic ecosystems.
Residential discharge – homes nearby where treated water from watering gardens and washing cars can runoff into nearby waterways
Urban/road discharge – there’s a road nearby that is salted during winter months, indicative of higher conductivity readings from chloride levels
Industrial discharge – a factory nearby that may be negatively impacting water quality readings
Evidence of water uses
How are people interacting and influencing the environment? Is there heavy boating traffic, which can disturb sediments and increase turbidity? Are people fishing? Understanding how people interact with the environment can indicate the ways in which humans have an affect on the environment.
Traffic/boats disturb sediments and can increase algal growth. Boats also bring ballast water and invasive species, such as zebra mussels attached to the hull, that impact the waterways they have been transferred to. Deposits left by boats can also change the water’s chemistry and can make the environment overly alkaline or acidic. Read more about how boats affect the environment here.
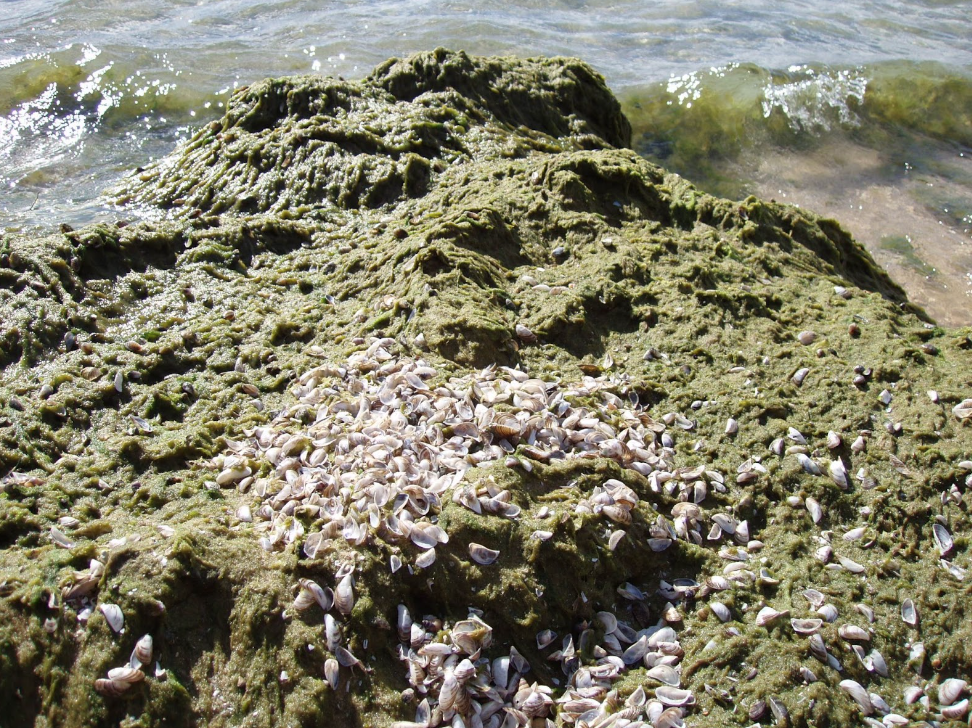
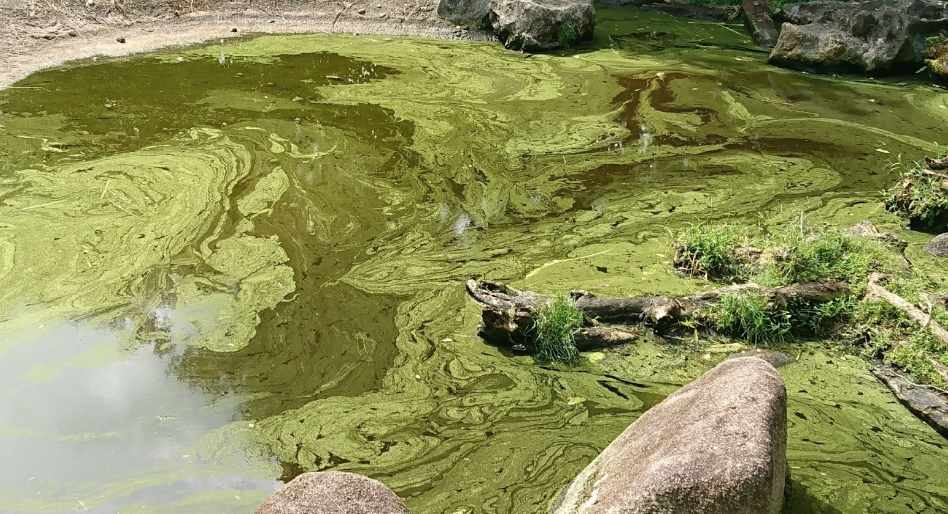
Algae
Algae is a term used to describe photosynthetic bacteria. Typically you will see mats of green, small algae on the surface of the water. Harmful algal blooms, such as cyanobacteria otherwise known as blue-green algae, can be toxic to humans and animals if ingested.
Cladaphora – non-toxic “nuisance” algae, is another algae that benefits from increase nutrients in the water. This stringy green algae that washed up in smelly mats on our shorelines earned the name “nuisance algae” due to its increasing presence and impact on freshwater ecosystems in the Great Lakes.
Cyanobacteria – HABS (harmful algal blooms) are harmful to both humans and the environment, and can majorly deplete dissolved oxygen levels which are vital to the survival of all aquatic life. When there is an overgrowth of cyanobacteria (also know as blue green algae) they can form a HAB. In warm, nutrient-rich environments, cyanobacteria can multiply quickly. When these bacteria multiply quickly, they form what are known as blooms. Moreover, they can be toxic. When these blooms become toxic they can severely impact the drinking as well as recreational water quality for humans, aquatic life, and any animals using the water as a drinking or food source.
Water flow
Water flow determines how much the water and sediments are being turned up in your waterway. Fast flowing water may be less affected by pollution events because pollutants are swiftly moved through an ecosystem. Stagnant water has a lowered ability to dilute pollutants. Still water can also favour algal blooms, due to a warm layer of warm water that sits on top of a cooler layer.
Take note of the water’s flow along with your other qualitative observations.
Water level
What level is where the water typically reaches land and is variable throughout the year. Many factors influence water levels. Water levels change year to year working through a ten year cycle from low to high levels. Water levels can be higher or lower than average due to the direction of the wind. You may also see higher water levels when sampling following a storm.
Water levels impact a range of ecosystem functions, but most importantly wetlands. When water levels are low for long periods, sensitive wetland ecosystems may begin to dry out. Likewise, high water levels can drown wetland environments that are highly biodiverse.
Water colour
Many things can influence water colour, making it anywhere from clear, dark blue, brown, yellow, green, or even red. The water’s colour can mean many different things. Clear water could be an indication of low productivity. Yellow or brown water can indicate organic matter and sediment accumulation in a water body. Same algae and dinoflagellates can also cause the water to turn a reddish or deep yellow colour.
Clarity
Water clarity is how far sunlight can travel down the water column. Water clarity is affected by how much suspended sediments are present in the water. In areas with more boat traffic or higher turbidity sediments are more likely to be churned up.
Water clarity can determine how much light is able to reach aquatic vegetation. This is important for aquatic life as the vegetation produces oxygen, habitat, and food for many organisms. Essentially clarity can be an indication of how productive an ecosystem is.
Odour
An odour at your sample site could be indicative of something else occurring in the environment. Taking note of odours provides context for poor water quality readings. An odour emanating from the water can smell like sewage, petroleum, or algae. It means that there could be a toxic algal bloom or urban or industrial discharge running off into the water body.
Record your observations!
When you’re finished testing make sure to upload your observations through our IOS app or through our data platform!