Water dynamics: temperature, salinity and density
Summary
Did you know that water temperature plays a vital role in how all of our water systems work? In this lesson, students will explore the relationship between water temperature, salinity and density, and their impact on water systems. Through engaging activities, they will investigate the formation of layers in water bodies and how they connect to nutrient mixing and currents.
All of our lessons are designed with two parts — an in-classroom and a field component. You can choose to do the lessons in succession over multiple days, at a convenient time, or teach either part as a stand-alone lesson. The activities are presented as small group activities to facilitate and encourage active participation. At the bottom of the page, you will find a section on ocean and real-world connections, external links to learning resources and additional activities for a wider range of ages, and a glossary of terms.
Recommended grades
This activity is recommended for grades 7 to 9. We’ve included tips to adapt the activity for a wide range of students throughout the lesson.
Learning outcomes
- Use scientific tools to accurately measure air and water temperature.
- Conduct an experiment to model currents in water systems.
- Examine the relationship between temperature, salinity, and density.
- Recognize the significance of temperature in maintaining the health and functioning of lakes and oceans.
Lesson
Background
What is water temperature and why is it important?
Water temperature tells us how hot or cold water is. It’s an important factor in understanding aquatic environments and impacts other parameters we measure like pH, dissolved oxygen, and conductivity. It plays a vital role in determining water’s ability to support life, absorb gases, and take in nutrients by affecting water density. Different aquatic species also have their preferred temperature zones. Some plants thrive in warmer waters, while certain fish, like trout or salmon, prefer cooler streams.
What is salinity?
Salinity refers to the measurement of salts dissolved in water, but not the same salt we use to season our food! Salinity in water comes from sources like rocks and soil and becomes less concentrated when ice melts or rivers flow into saltwater bodies.
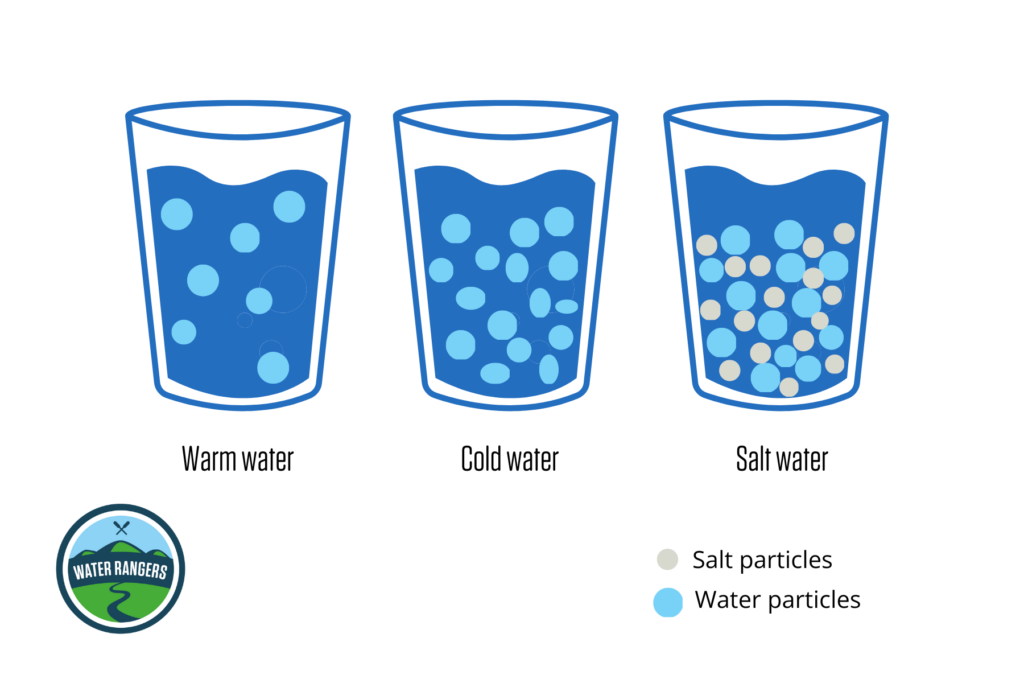
What is density?
Density is a measure of how tightly or loosely particles are packed together in a substance relative to its mass and volume. In water, warmer temperatures cause the particles to expand, making the water less dense. On the other hand, colder water has tightly packed particles, making it more dense. When it comes to saltwater, the presence of salt particles increases the density of water. Saltwater contains both salt and water particles, so it’s denser than freshwater.
When water is denser, it contains more particles and is heavier, causing it to sink. On the other hand, lighter and less dense water rises up. Temperature and salinity are the two factors that influence water density in the ocean, affecting water movement. Understanding density allows us to interpret the intricate dance of water molecules that shape patterns in aquatic ecosystems!
Modeling ocean currents
Location: In the classroom
Duration: 45 minutes
Objective: Observe the effects of salinity and temperature on water density through an experiment modeling ocean currents.
Groups: We recommend groups of 3-5 students for this activity.
Materials needed
- Table salt
- Dark food colouring (blue or black)
- Ice tray (2 ice cubes per group)
- Tablespoons
Per group:
- 3 glasses or beakers of room temperature (warm) tap water
- 100 mL glass or beaker of room temperature tap water coloured dark blue with food colouring.
Preparation
- Add several drops of food colouring to water and freeze overnight to create dark-coloured ice cubes.
- Freeze at least 2 ice cubes per group.
- You can prepare room temperature water for the students by leaving several pitchers of water out for a few hours for them to pour in their glasses during the experiment, or fill the glasses for the students ahead of time.
- With one group per station, stations should have one half-full glass (glass A), 2 full glasses (glasses B and C) of room-temperature water, and 100ml glass or beaker of room temperature water coloured dark blue before starting.
Steps
Exploring salinity and density
Teacher tip!
This part can be tricky! Watch this video for more details and demonstrate it to your class before performing.
Ocean science in your kitchen- Instruct each group to label the glasses A (saltwater), B (saltwater), and C (tap water) for control.
- To create the saltwater in glass A, each group can mix the half a glass (150 ml) of room-temperature water with one full tablespoon of salt. Mix the water well until the salt is dissolved.
- Ask students to write down their predictions on what will happen when they mix the coloured tap water with the saltwater (glass A).
- Tilting glass A, gently pour the coloured tap water into the glass, letting it run on the side to avoid splashes.
- Ask students to observe and note any changes in colour and movement when the coloured tap water meets the saltwater.
The saltwater in glass A has a higher density than the blue tap water because salt particles are packed with the water particles. When the blue tap water is added, it floats on top of the saltwater. The denser saltwater sinks to the bottom of the glass, while the less dense blue tap water floats at the top. Some of the coloured tap water may mix with the saltwater in the middle.
Exploring salinity, temperature, and density
Suggestions for enrichment
Check out the ‘Ocean connections’ section to explore the concept of ocean currents and ocean stratification. You can discuss convection currents, how rising temperatures are affecting ocean currents, and how melting ice changes temperature and salinity. You can also add red food coloring and hot water to enhance the experiment and create more distinct layers – just like the ocean!
Example video using red and blue food coloring- Have the groups fill glass B and C with room temperature water if it is not already done.
- In glass B, add a full tablespoon of salt into the water and mix until it dissolves. This makes glass B more dense than glass C.
- Pass 2 ice cubes to each group. Instruct students to place 1 ice cube in glass C as a control. Ask them to write their predictions as to what will happen before dropping the ice cube and then note their observations of how the water moves and changes colour.
- Repeat the experiment with glass B, writing predictions and observations.
Cold water (ice) is more dense than the room temperature water in glass C, so it sinks. However, the cold water eventually mixes with the warm water in the glass and begins to warm up, becoming less dense and rises again. Glass B is filled with salty water, which is more dense than tap water so the cold coloured water does not sink as much. Even though cold water is more dense than warm water, it can sit on top of the warm water because it has a high salinity.
Discussion and reflection
- What did you observe when the coloured tap water was poured into the saltwater? How did the colours and movement change?
- Why did the coloured tap water float on top of the saltwater? What does this tell us about the density of saltwater compared to tap water?
- What role does salinity play in the density of water? How does the addition of salt affect the density of water?
When you go swimming and go to the bottom, you may notice that it’s cold down there! Like the classroom experiment, warm water will rise to the surface of the water because it is less dense, while cold water sinks to the bottom. In natural water bodies like lakes and oceans, this vertical movement of water creates layers with different temperatures. These layers facilitate the mixing of nutrients through convection currents, where warmer, less dense water rises, while colder, denser water sinks. This process allows nutrients from the bottom to mix with the surface waters, supporting life throughout the water body.
Exploring temperature with different sample locations
Location: In the field at a local water body.
Duration: 30 minutes
Objective: Collect water samples from various locations around a local water body to measure temperature using a thermometer and conductivity meter.
Groups: We recommend groups of 5 students maximum for this activity.
Materials needed
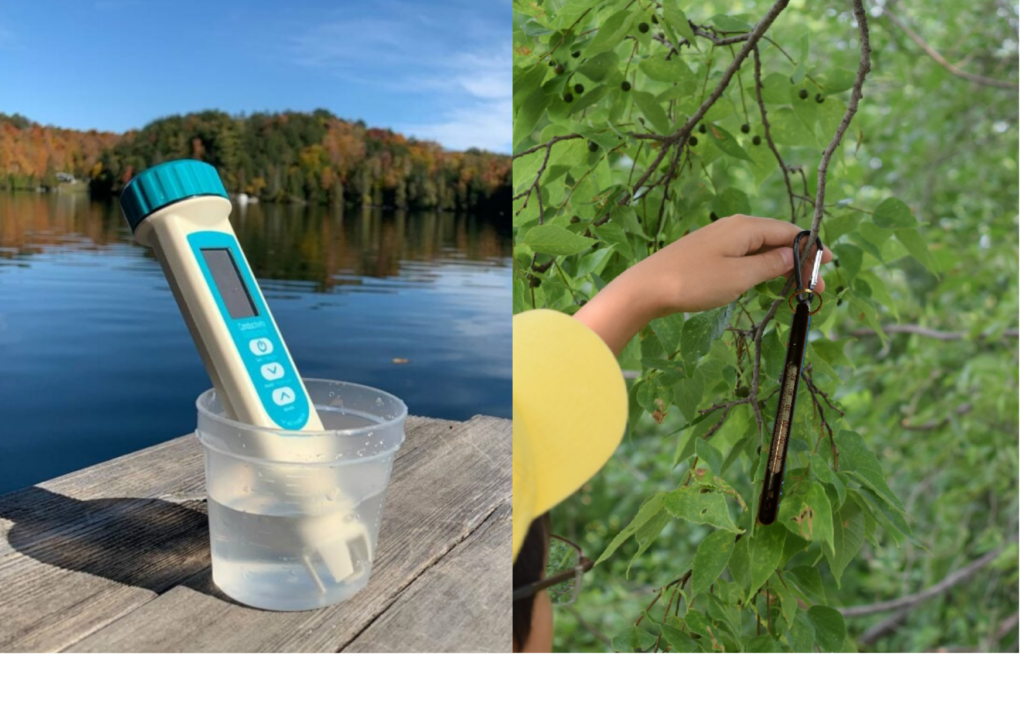
- Thermometer
- Conductivity meter
- Sample cups
- Reacher sticks
- Notepads
Do you have your Education testkit?
All materials for outdoor activities can be found in the Water Rangers education testkit.
Education testkitThis activity involves looking for different spots around your local water body and taking various samples. Please refer to the safety tips in your educator’s guide, as well as our testing location guide and general tips to choosing a sample location. Always make sure to:
- Fully extend the arm of the reacher stick so students can easily access the water.
- Choose a site away from fast moving water where youth can easily reach the water.
- If the water is deeper than 0.5m, students must wear a lifejacket.
- Be extra careful around cold water.
Steps
Observations
- Ask students to observe their surroundings.
- What do they see/notice?
- What sounds do they hear?
- What do they smell from where they stand/sit?
- Hand out the notepads to students and decide as a class the weather from the previous day and the current weather. Get them to record this in their notepads.
- Based on students’ observations, ask them to identify different water sources that could have different temperatures. These could include puddles, shallow and deeper locations, areas in the sunshine, and areas with or without vegetation.
- Use your discretion to determine if samples from students’ suggested locations can be collected safely.
Recording air temperature
- Based on their observations, ask students to guess the air temperature.
- Provide each group with a thermometer.
- Instruct students to hang the thermometer under a tree or another shady spot where the testing is being conducted.
- Ensure the thermometers are at least 1.5 meters off the ground.
- Leave the thermometers there for 5 minutes before reading the values. You can choose to record the values after completing the water sampling.
Preparing to collect a sample
Our senses often deceive us! If possible, get students to stick their finger in the water and guess the temperature before collecting and testing their sample.
- Give each group a reacher stick, sample cup, and conductivity meter.
- Hook the reacher stick onto the sampling cup and ensure it holds tightly just below the lip of the sample cup.
- Fully extend the reacher stick.
- Remind the students to keep the reacher stick below shoulder level for their safety.
- Remind students to rinse the sample cup three times and ensure their hands are dry before using the strips.
- Turn on the conductivity meter by pressing the top button.
Collecting and testing the sample(s)
- Based on the agreed sampling locations, ask students to predict whether they think the water will be warmer or cooler and to guess the units.
- For each approved location, have each group collect a sample and place the conductivity meter in the sample cup water. Or, each group can collect one sample from a location of their choosing that has been approved.
- Hold the conductivity meter in the water, swishing it around lightly until both values on the meter remain steady for 30 seconds.
- The smaller lower value on the meter will show the temperature in degrees Celsius. The top value is the conductivity in microSiemens per centimetre. For this experiment, it’s not important to record conductivity.
- Repeat this process for each location, encouraging students to try collecting samples from different depths (surface and deeper samples).
- Return to the thermometers and record air temperature.
Reflection and discussion
Teacher tip!
The discussion and reflection section can be used to evaluate students’ knowledge.
- What factors do you think contributed to the temperature variations in the samples?
- How did the air temperature affect the water temperature? How does this change with freshwater and saltwater bodies?
- How does water depth change the temperature of the water? What do you think this means for the aquatic life in the water body?
What is happening?
Air temperature affects the temperature of water bodies. When the air is warm, it can transfer heat to the water, causing the water temperature to rise. And when the air is cold, it can cool down the water. The effect of air temperature on water temperature can be different in freshwater and saltwater bodies. Freshwater tends to change temperature more quickly in response to changes in air temperature because it has a lower density compared to saltwater. Saltwater, such as in the ocean, is denser and can hold heat more effectively, so its temperature changes more slowly.
The temperature variations caused by air temperature and water depth have important implications for aquatic life. Some organisms prefer warmer water near the surface, while others are adapted to the colder depths. The mix of different temperatures in a water body lets diverse species coexist.
Ocean connections
Ocean stratification
The relationship between salinity, temperature, and density influences the structure and dynamics of the ocean. Differences in these factors causes water to move vertically: denser water sinks while less dense water rises. Ocean stratification is a natural occurrence and organizes water layers based on density, creating different zones in the ocean. Ocean stratification affects the distribution of heat, nutrients, and oxygen in the ocean, which also impacts where marine life can be found. In an unstressed ocean ecosystem, currents, wind, and tides mix the layers creating smooth transitions and nutrient exchange between them.
Climate change is making ocean stratification stronger. As the Earth’s atmosphere gets warmer, the ocean absorbs more heat, causing the surface waters to warm up. This strengthens ocean stratification and makes it harder for water to move between different layers. This can reduce the availability of nutrients in the surface waters, which affects the growth of plants and animals in the ocean. These changes also affect the flow and strength of ocean currents, which can have effects on weather, ecosystems, and the overall climate.
Check out this great video on ocean stratificationReal world connections
Lake stratification and meromictic lakes
Lake stratification occurs when layers of water with different temperatures and densities form in a lake, creating distinct zones that do not mix thoroughly. In warmer seasons, the surface water is warmer and less dense, while deeper water remains cooler and denser, leading to stable layers. This stratification influences nutrient distribution, oxygen levels, and habitats for aquatic life in the lake.
Although most lakes’ water mix completely during a typical year, not all do! In Val-Des-Monts, Quebec, Water Rangers’ research on Lake McGlashan revealed that it’s is a meromictic lake. This means that distinct layers of water with varying properties do not mix thoroughly. This phenomenon impacts the lake’s ecosystem, influencing factors like dissolved oxygen levels and aquatic life distribution.
Check out our blog post on Lake McGlashan.
Learn more about lake stratification in this videoAdditional resources
Lesson resources
Long story shorts: what is ocean stratification?
Introduction to lake stratification
Turnover, lake mixing and stratification
Additional activities
How salt affects buoyancy experiment
This easy and effective experiment is great for younger grades! It uses eggs, saltwater, and sugar water to demonstrate the impact of salinity on water density and buoyancy. Eggs are placed in different water solutions to observe how the densities affect whether the eggs float or sink — just like how much easier it is to float in the ocean compared to a lake!
Warm water rises and cold water sinks
Take your model further by adding hot water with red food colouring to the mix and see what happens! As warm water rises and cold water sinks, students can witness the movement, displacement, and eventual mixing of the different water temperatures. This engaging activity offers students a visual demonstration of water circulation, deepening their comprehension of this natural phenomenon.
Glossary
Control sample: A sample used as a baseline or reference to compare with other samples. In experiments, it helps understand the initial conditions before any changes or treatments
Convection current: A fluid movement driven by differences in temperature and density, where warmer, less dense material rises and cooler, denser material sinks, creating a circulating flow pattern.
Currents: The steady movement of water in a specific direction.
Ocean currents: The continuous movement of seawater driven by forces like wind, temperature, salinity, the Earth’s rotation, and tides.
Ocean stratification: The layering of water in the ocean based on differences in temperature, salinity, and density.
Particles: Tiny pieces of matter that make up everything around us.
Volume: The amount of space something takes up.