Investigating road salts with conductivity
Summary
In this lesson, learners will explore the impact of road salt on water quality using conductivity as an early pollution indicator. Through qualitative observations and conductivity testing, they will investigate their local environments and identify potential pollution sources. We also have enrichment suggestions that help to develop data analysis skills and encourage raising awareness of road salt’s negative effects on water bodies!
All of our lessons are designed with two parts — an in-classroom and a field component. You can choose to do the lessons in succession over multiple days, at a convenient time, or teach either part as a standalone lesson. The activities are presented as small group activities to facilitate and encourage active participation. At the bottom of the page, you will find a section on ocean and real-world connections and a glossary of terms.
Recommended grades
This activity is recommended for grades 10 to 12. We’ve included tips and tricks to adapt the activity for a wide range of students throughout the lesson.
Learning outcomes
- Identify conductivity as an early indicator of pollution in water bodies.
- Explore the impact of road salts on water quality.
- Evaluate how built and natural environmental factors influence conductivity values.
- Measure conductivity and chloride in water samples using scientific tools.
- Collaborate in groups to collect and analyze data related to road salt contamination.
- Recommend ways to mitigate the negative impacts of road salt usage in your community.
Background
What is conductivity?
Conductivity measures how well water can carry an electric current. It tells us about the presence of substances in the water. Some substances, called ionic compounds, like chloride, nitrate, sulfate, sodium, magnesium, calcium, or iron, can dissolve in water and contribute to its conductivity. The more dissolved substances there are, the higher the conductivity.
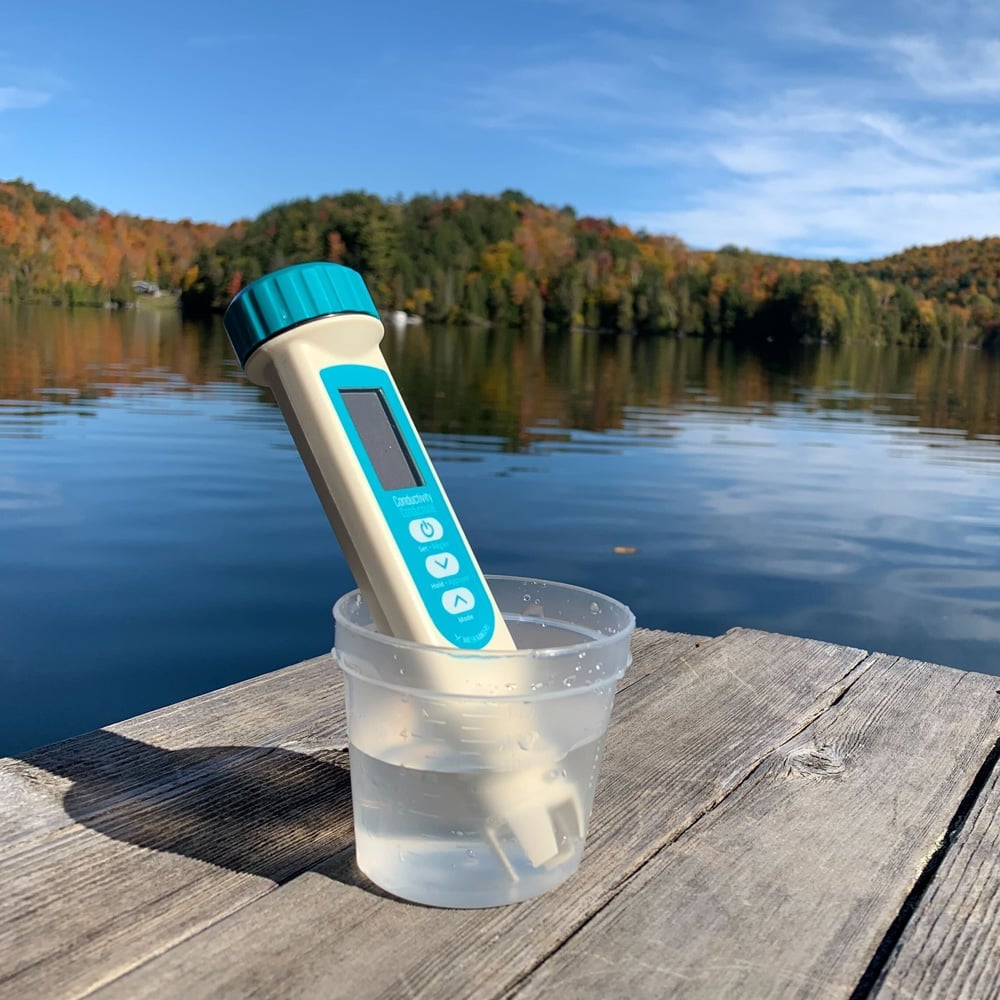
How to use Water Rangers’ conductivity meter
In this video, you’ll learn what conductivity is and how to test for it using Water Rangers’ conductivity meter. The top video is in English and the bottom one is in French.
Why is conductivity important?
Conductivity is an important way to check the quality of water. Each body of water has its own conductivity level, so we can use it as a baseline to compare changes. If there are big changes in conductivity, it could mean there is pollution in the water. We can use conductivity to find out if something harmful has entered the water, like pollution from factories or other sources.
What is chloride?
Chloride is a kind of substance that has a negative charge as it’s formed when chlorine gains an extra electron. It’s often found in salts that can dissolve in water, like road salts. Natural bodies of water have different amounts of chloride because of the rocks and soil around them, but human activities like farming, factories, and using road salts can make the chloride levels go up. Testing for chloride can show if there is pollution in the water. High levels of chloride can harm plants and animals that live in the water.
How to use Water Rangers’ chloride strips
In this video, you’ll learn how to measure chloride using Water Rangers’ chloride strips. The top video is in English and the bottom one is in French.
What are road salts?
Road salts are substances used to melt ice on roads during winter. They are mostly composed of sodium chloride (table salt), calcium chloride, and magnesium chloride. Road salts help make roads safer by preventing them from being slippery.
How do road salts affect the environment?
When it gets warmer, road salts melt and flow into nearby rivers and lakes through runoff. This makes the water have more of certain substances, which affects its conductivity. This change in the water can harm the environment in different ways. It can harm plants and animals that depend on the water. It can also damage roads and vehicles, and it can even be a health concern for people.
Testing for road salts in your community
Has it snowed recently where you live? Perfect! Now’s the time for a great snowed-in classroom activity to demonstrate the impact of road salts on conductivity and your local ecosystems.
Location: In the classroom
Duration: 45 minutes
Objective: To investigate the impact of road salts on water quality by testing the conductivity and chloride levels of snow samples collected from various locations and to analyze the correlations between qualitative observations and quantitative measurements.
We recommend groups of 5 students maximum for this activity.
Materials needed
Want to test for chloride?
Chloride strips aren’t included in your educational testkit, but you can order them separately in our store.
Order chloride test strips- Water Rangers conductivity meters
- Small containers with lids (e.g. food containers, bottles)
- Snow samples (from home and/or school)
- Notebooks or observation sheets
- Water Rangers chloride test strips (optional for additional measurements)
- Cloth towels
Preparation
Safety tip!
For younger students, ensure their parents are aware of the experiment and assist them in collecting a snow sample. For older students, go over general safety guidelines, including heightened awareness of their surroundings when getting their snow sample.
- Encourage at least 3 students per group to bring snow samples from home in small containers with lids. It’s okay if it melts!
- Students can be creative with where they collect their sample from and should note observations of the area the snow was collected from.
- If students are unable to bring a sample from home, they can collect a sample of snow at school.
Steps
1. Collecting a control sample and snow sample from school
- Instruct one student in each group to take a snow sample from an approved location on the school grounds, ensuring their safety.
- Emphasize the importance of observing the area where the snow sample is collected.
- Instruct each group to collect a tap water sample as the control sample.
2. Recording qualitative observations
- Ask each student to describe where they collected their snow sample and record qualitative observations on their observation sheet, noting factors like proximity to roads or industrial areas.
- Emphasize the role of qualitative observations in understanding potential sources of pollution.
Teacher tip!
To enhance observations for older students, you can provide them with preset categories to record their observations that cover built and natural environmental factors. Such as:
- Population density: high, medium, low
- Distance to city or major road: close, moderate, far
- Land use: urban, industrial, agricultural, residential, natural
- Vegetation: dense vegetation, sparse vegetation, no vegetation
- Infrastructure: highways, bridges, parking lots, sidewalks, driveways
- Weather conditions: snowfall intensity, temperature, precipitation
3. Conductivity testing
- Distribute the conductivity meters to each group.
- To use the conductivity meter:
- Turn on the meter by pressing the top button once quickly.
- Dip the meter into the sample, avoiding submerging the entire device.
- Swish the meter lightly in the water until both values on the meter stabilize.
- Instruct students to record the conductivity values of each sample.
- Remind students to dry the meter with a towel before testing each sample to ensure accuracy.
- Note: Conductivity is measured in microSiemens per centimetre (µS/cm). If a decimal reading is obtained (e.g. 1.3), multiply it by 1,000 to convert it to microSiemens (1,300). If there is an error message (ERR) on the conductivity meter, it most likely means that the conductivity in the sample is higher than what the meter can measure (3,999 microSiemens per centimetre).
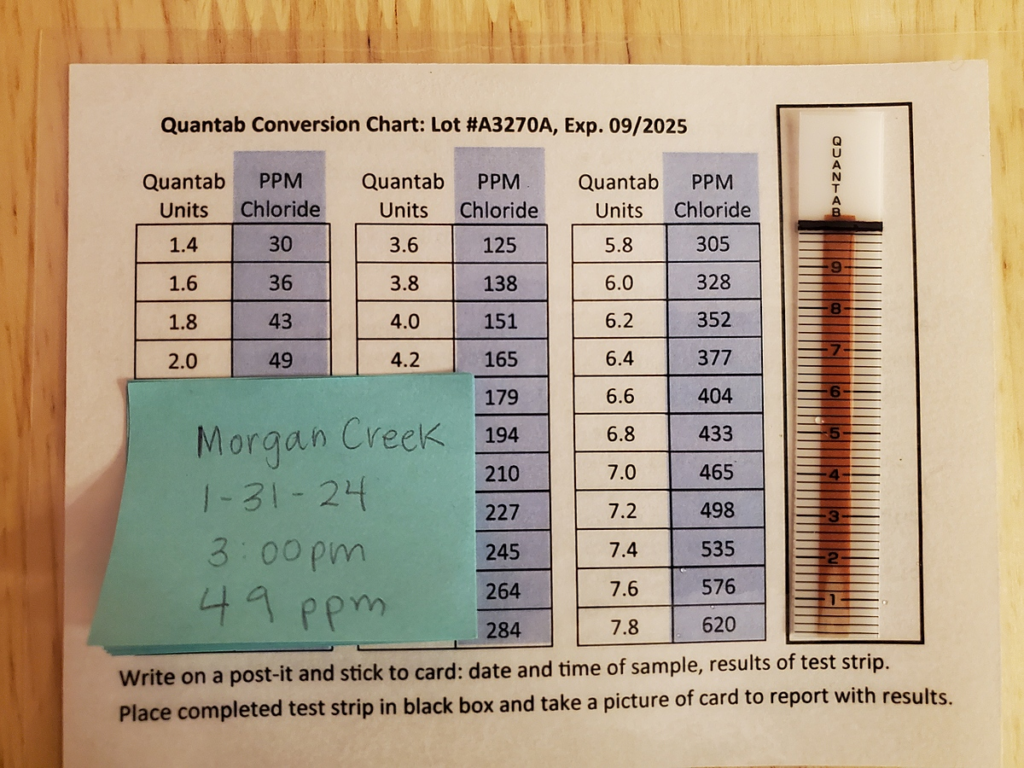
4. Chloride testing (optional)
- Distribute the chloride teststrips to each group.
- Instruct students on how to use the chloride strips:
- Ensure dry hands when handling the strips.
- Dip the strip into the sample up to the indicated line.
- Wait for about 3 minutes until the orange strip at the top turns black.
- Read the chloride level from the white line and compare it to the provided comparator chart.
- Chloride test results are recorded in parts per million (ppm).
5. Comparison and discussion
- Bring the groups together to discuss their findings.
- Ask each group to share their observations, conductivity and chloride measurements, and any correlations they notice.
- Facilitate a class discussion on the impact of road salt and the water cycle, linking the collection points of the snow samples to the possible sources of road salt contamination.
- Encourage students to consider how road salt ends up in bodies of water through runoff, groundwater discharge, and its impact on the environment.
Teacher tip!
The discussion and reflection section can be used to evaluate the student’s knowledge.
Discussion questions
- How did your qualitative observations correlate with the conductivity and chloride measurements? Were there any surprises?
- Based on your findings, how would you expect stream water in an area with a lot of roads to compare to stream water in an area like a forest without any roads?
- How can individuals strike a balance between the necessity of maintaining safe roads and the responsibility to minimize its negative effects on the environment and community well-being?
Road salts don’t just stay on the roads but can take different paths. After being sprinkled on the roads, they can flow into nearby streams, ditches, and culverts, spiking the salt level in these water bodies. Studies show they build up in soils near roads, groundwater, and the muddy layers at the bottom of lakes and wetlands. They might go directly into streams or rivers, ride along with rivers into the sea, settle into different layers of lake water, or move straight into deep underground rocks. Learning about these paths helps us understand how road salt impacts the environment over a long time. Learn about what researchers at Western University are doing to tackle road salts
Suggestions for enrichment
Mapping student observations using Google Maps
- Use Google Maps to map out classroom observations and the locations where snow samples were collected:
- Go to Google My Maps and create a new map.
- Give your map a title and description for the classroom activity.
- Click on “Add Layer” to create a new layer for the snow sample locations.
- Name the layer (e.g. Snow sample locations).
- Click on Base Map to change the reference map. “Satellite” is great for viewing industrial activity and “Dark Landmass” gives good insight into the water bodies nearby!
- Each group can choose one or two snow sample locations to pin on the map.
- Provide each group with access to the classroom map.
- Instruct each group to locate their chosen sample location on the map.
- Click on the “Add Marker” button in the toolbar of the map.
- Click on the location where the sample was collected to drop a pin.
- Add a title to the pin (e.g. Group 1 Snow Sample).
- Add the recorded conductivity and chloride measurements, as well as any descriptions about the location in the notes.
- Save the pin to the “Snow Sample Locations” layer.
- Repeat this process for each group’s chosen location.
- Analyze patterns and trends:
- After all the snow sample locations have been added to the map, facilitate a class discussion on the patterns and trends observed.
- Use the preset categories for observations and the notes/descriptions added to the pins to guide the discussion.
- Encourage students to look for correlations between the sample locations, qualitative observations, and the conductivity and chloride measurements.
- Discuss any patterns or trends that emerge, such as higher conductivity or chloride levels in samples collected near roads or areas with high human activity.
- Explore the impact of different factors on water quality based on the collected data and observations.
Mapping the water cycle of sample locations using River Runner
- Have students create a map or diagram illustrating the water cycle from the collection points of their snow samples.
- Encourage students to include elements such as snowfall, road salt application, types of runoff, and the eventual flow of water into bodies of water.
- Provide students with the option to use an interactive map that shows the path of a raindrop anywhere in the world. This interactive map can be accessed at: River Runner
- Note: The interactive map functions best for the US but can be explored globally.
Testing conductivity in a local body of water
Location: In the field at a body of water
Duration: 45 minutes
Objective: To make physical observations in the outdoor environment and inquire about road salt contamination by predicting and then measuring conductivity and chloride levels in a local body of water.
Groups: We recommend groups of 5 students maximum for this activity.
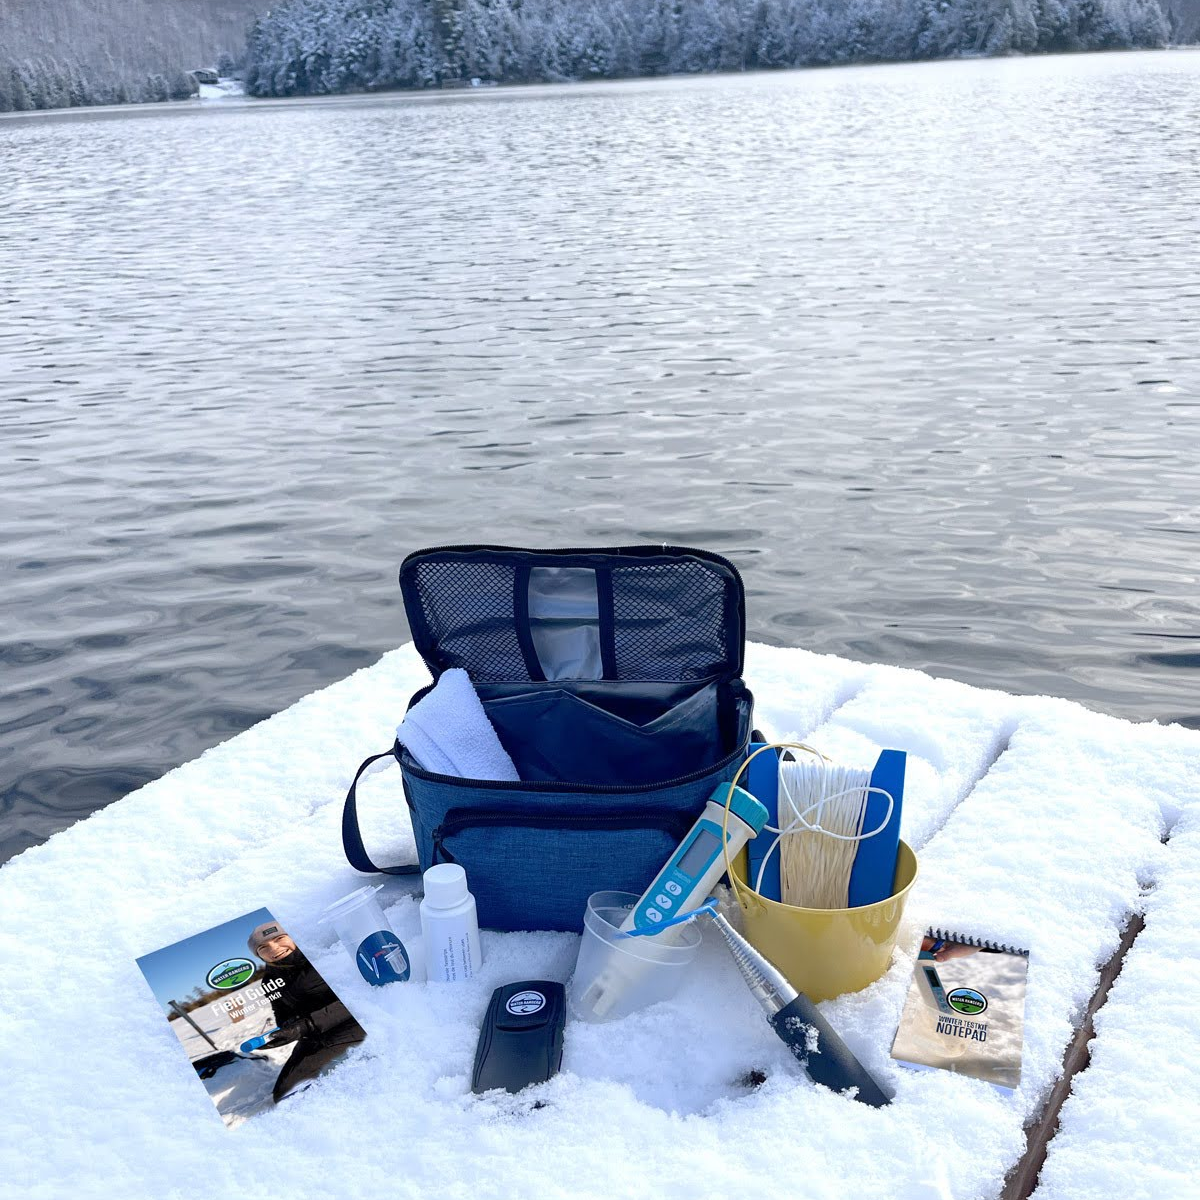
Materials needed
- Conductivity meters
- Chloride teststrips (optional for additional measurements)
- Sample cups
- Reacher sticks
Do you have your Education testkit?
All materials for outdoor activities can be found in the Water Rangers education testkit.
Education testkitAlways refer to the safety tips in your educator’s guide, as well as our testing location guide and general tips to choosing a sample location when testing outdoors.
Steps
1. Observations
- Ask each group to observe their surroundings, focusing on potential sources pollution like road salt contamination.
- What do they see/notice?
- What sounds do they hear?
- What do they smell from where they stand/sit?
- Encourage them to note areas near roads, parking lots, sidewalks, where road salt may have been applied, as well as drains and sewage pipes.
- Observation prompts:
- Are there visible signs of recent snow or ice treatment with road salt?
- Is this an area near high density roads or traffic?
- These observations will serve as clues for predicting conductivity and chloride levels.
2. Prediction
- Based on their physical observations, have each group make predictions about the conductivity and chloride levels of the water. Do they think the environment is more likely to have low or high conductivity and chloride levels due to road salt use?
- Ask them to provide reasoning for their predictions.
3. Collecting a sample and testing conductivity
- Distribute the reacher sticks, sample cups, and conductivity meters to each group.
- To test for conductivity:
- Turn on the meter by pressing the top button quickly.
- Dip the meter into the water. Hold it in the water until the values stabilize.
- Read the measurements. The conductivity value is the larger one on the top and is recorded in microSiemens per centimetre (µS/cm). Multiply by 1,000 if the value is a decimal. If there is an error message (ERR) on the conductivity meter, it most likely means that the conductivity in the sample is higher than what the meter can measure (3,999 microSiemens per centimetre).
4. Testing for chloride
- Distribute the chloride strips to each group.
- Ensure that students have dry hands when using the strips.
- The orange strip at the top of the test strip will turn black when the test is complete (about 3 minutes).
- The white line going up the strip will indicate the chloride level of your sample.
- Take the reading from the closest line to the white and compare it to the graph on your sample bottle.
- Record your results in parts per million (ppm).
4. Reflection and discussion
- After testing, give each group time to reflect on their predictions and compare them with the actual conductivity and chloride results.
- Facilitate a class discussion where groups can share their observations, predictions, and test results. Discuss any surprises or patterns noticed if different areas in the water were tested.
- Emphasize the connection between road salt application, increased conductivity and chloride levels in the environment. Discuss the potential impact on local ecosystems and water bodies.
Discussion questions
- How did your qualitative observations correlate with the conductivity and chloride measurements? Were there any surprises?
- What factors do you think influenced the presence or absence of road salts? The time of year you are testing, location, general seasonal patterns, etc. can all affect whether your values may be higher or lower.
Suggestions for enrichment
Research and community outreach
- Challenge students to create awareness about the environmental impact of road salts in their community.
- Encourage research on alternative de-icing methods, exploring the pros and cons.
- Discussion Questions:
- What are the potential benefits and drawbacks of alternative de-icing methods for both road safety and environmental conservation?
- How can communities strike a balance between ensuring road safety and actively participating in environmental conservation?
- What is your municipality’s approach to de-icing? Are they aware of the impact of road salts? How can students engage with local authorities or community groups to promote sustainable winter road maintenance practices?
Extended field study
- Assign students to conduct a more extensive field study, measuring conductivity and chloride levels in various locations over an extended period.
- Encourage detailed record-keeping and the identification of trends or patterns.
- Discussion questions:
- What variations in conductivity and chloride levels did you observe over time and across different locations?
- How do seasonal changes or weather patterns correlate with your data?
- What connections can be made between your findings and road maintenance activities in the area?
Ocean connections
The presence of dissolved ions, including salts like sodium, increase both salinity and conductivity — therefore the two measures are related. A salinity meter measures ions from salts only, while a conductivity meter detects ions from salts and other sources. Oceans have high salinity and conductivity due to many dissolved salts. Most ocean salt comes from runoff, sediment, and tectonic processes. Rain, containing carbonic acid, helps in rock erosion. As rain moves over rocks and soil, minerals and salts break down into ions, eventually reaching the ocean. Oceanographers use conductivity to assess the presence of different substances, chemicals, and minerals in seawater.
Why do oceanographers measure the conductivity of seawater?Real world connections
Canada, being a country with widespread and harsh winter conditions, depends on road salts for winter safety. Even though it’s cost-effective, road salts lead to billions in damages for society and ecosystems. They corrode vehicles, degrade infrastructure like bridges, and harm the environment, affecting water systems, soil, and wildlife. Due to the priority of road safety, Canada won’t ban road salts. Instead, it follows a risk management approach, emphasizing best practices for storage, spreading, and snow disposal. Read more about Canada’s approach here.
Community spotlight
This blog post highlights Chris Herc, a dedicated Water Ranger who has been investigating the effect of a Canadian winter on our waterways. Read about the locations he’s tested in north-western Ontario, and why community science is so important!
In the news – ‘How Canada’s addiction to road salts is ruining everything’Curriculum links
Check out our curriculum connections to see how these activities fit into the curriculum of various provinces.
Glossary
Baseline: Initial conditions used as a reference point for comparison.
Carbonic acid: A weak acid from carbon dioxide in water that aids in rock erosion.
Culverts: Structures, typically pipes or tunnels, used to channel water under roads, trails, or similar obstacles, allowing water to flow without disrupting the surface.
Control Sample: A sample used as a baseline or reference to compare with other samples. In experiments, it helps understand the initial conditions before any changes or treatments.
Erosion: The natural process of rocks, soil, and minerals breaking down by elements like water, wind, and ice.
Groundwater: Water that is present beneath the Earth’s surface in soil and rocks.
Qualitative observations: Descriptive observations based on qualities such as appearance, smell, or location rather than precise measurements.
Risk management: Strategies and practices to minimize potential harm or damage associated with an activity or substance, in this case, road salt use.
Runoff: The flow of water, including any dissolved substances, from surfaces like roads into nearby bodies of water.
Sea: A large body of saltwater that is smaller than an ocean and is partially or completely enclosed by land. The sea is a crucial part of Earth’s hydrosphere.
Sediments: Particles that settle at the bottom of bodies of water, which can include soil, minerals, and other substances.
Tectonic: The movement and structure of the earth’s crust.