Water chemistry: acids, bases, pH and alkalinity
Summary
In this lesson learners will explore acids and bases in relationship to water quality, with a focus on their impact on aquatic organisms and ecosystems. Students will use Water Rangers teststrips to investigate the properties of acids and bases and connect them to pH and alkalinity, exploring how pH changes with everyday household products and test pH levels in their local environment.
All of our lessons are designed with two parts — an in-classroom and a field component. You can choose to do the lessons in succession over multiple days, at a convenient time, or teach either part as a standalone lesson. The activities are presented as small group activities to facilitate and encourage active participation. At the bottom of the page, you will find a section on ocean and real-world connections, external links to learning resources and additional activities to try, and a glossary of terms.
Recommended grades
These activities are recommended for grades 8 to 10. We’ve included tips to adapt the activities for a wide range of learners throughout the lesson.
Learning outcomes
- Use water quality teststrips to record pH results.
- Evaluate the potential impact of household products and pollution on water quality.
- Relate acid/base properties to their respective positions on the pH scale.
- Recognize the significance of pH in determining water conditions for supporting aquatic life.
How to use Water Rangers teststrips
In this video, Kat explains how to use and read the measurements on Water Rangers teststrips.
Background
Acids and bases
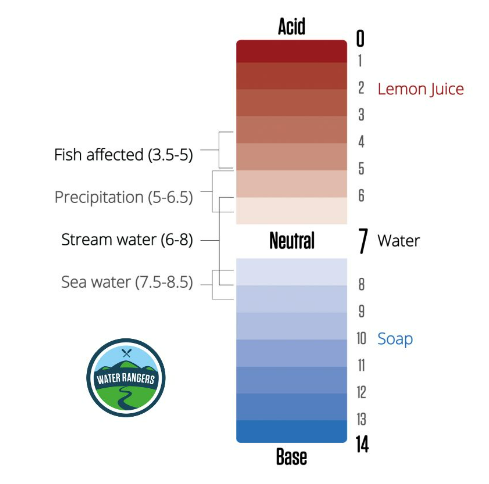
Acids and bases play crucial roles in water quality assessment, influencing the conditions that support aquatic life. Acids are often described as having a sour taste, while bases can be characterized as slippery or bitter. At an atomic level, acids release hydrogen ions into water and lower pH levels. Bases, on the other hand, accept hydrogen ions, raising pH levels and influencing alkalinity — bases are also referred to as alkaline.
pH and the pH scale
pH stands for “potential of hydrogen”, and the pH scale is a measure of how acidic or basic a substance is. It ranges from 0 (very acid) to 14 (very basic), with 7 being neutral. pH sets up the conditions for how easy it is for nutrients to be available for aquatic organisms, and how easily toxic substances can dissolve in the water. Different species thrive within different pH ranges, and waterbodies can range between 5 (acidic) and 9 (basic). You’ll need to create a baseline to determine what’s a normal pH level for your local waterbody!
Teacher tip!
For younger audiences, use relatable language and sensory examples to explain pH! Acids usually taste sour (like a lemon) and bases feel slippery (like liquid hand soap) — you can get them to draw their own pH scale based on the household items they test or foods they are familiar with in the classroom activity.
Alkalinity
Alkalinity is water’s ability to neutralize acid or resist decreases in pH. It acts as a buffer against rapid pH changes and is important for maintaining a stable pH range. Water’s pH and alkalinity are affected by inorganic minerals like rocks and soil, as well as organic matter from plants, bacteria, and fungi. Limestone, for example, can elevate alkalinity. Alkalinity’s measurement is expressed as milligrams per litre (mg/L) or parts per million (ppm) of calcium carbonate (CaCO₃) in a water sample. While high alkalinity doesn’t necessarily imply poor water quality, each body of water has its unique normal level shaped by environmental factors and influences. Once you find the baseline alkalinity of a waterbody, you should notice that it remains quite stable over time.
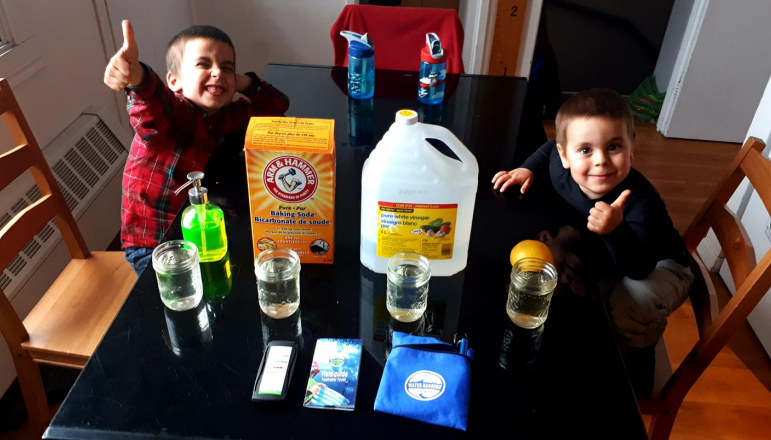
Observing changing pH with common household products
Location: In the classroom
Duration: 45 minutes
Objective: Use test strips to observe the changes in pH in common household products.
Groups: We recommend 5 students maximum per group for this activity.
Materials needed
- Paper and pencil
- Water Rangers teststrips in their container
- Minimum 4 sample cups per group (glasses, beakers, vials, or spot plates)
- Water to sample (tap is fine!)
- Minimum of 3 household liquids. You could use lemon juice, vinegar, dish soap, non-caustic cleaning supplies — get creative!
Preparation
- Ensure that each group has the materials listed above, including teststrip containers with indicator charts. Our education kit comes with three student containers with the indicator chart on the back as well as one refill container that also has the chart on the back. They should have at least one teststrip per household liquid they will be testing.
- Prepare the household liquids in each sample cup for easy access during the activity. You can also use spot plates or microplates to minimize waste.
- Students will be sampling tap water as a control. Water treatment differs from region to region, and if you suspect a pH other than 7 for your tap water you can use distilled water instead.
- Watch the short video above to familiarize yourself with the Water Rangers test strips and their usage to assist students effectively.
- Have a designated area for students to dispose of the liquids in a safe and environmentally friendly manner. Your education kit has a large envelope to put used teststrips that can be shipped back to Water Rangers for proper disposal.
Steps
1. Testing your control sample
Teacher tip!
For older students, encourage them to delve deeper into the chemistry behind pH. Discuss the role of hydrogen ions (H+) and hydroxide ions (OH-) in determining acidity and alkalinity. For each household product, introduce simple chemical equations representing their reactions in water.
- Make sure students’ hands are dry before using the teststrips.
- Instruct each group to take a water sample and dip a teststrip into it for 2 seconds.
- After 20 seconds, each group can use the indicator chart on the back of their test strip container to compare the colour of the test strip.
- At least two people should compare the colours together and make sure they agree on its reading.
- Record the initial pH reading. This will serve as their control. A control sample is a measurement that acts as a point of comparison in an experiment!
2. Changing pH
- Each group should take another water sample and add a very small amount of one household product.
- Instruct them to test the pH of the modified sample and record their results.
- Repeat this step for each household product provided.
3. Drawing and reflection
- Ask students to draw a simple pH scale and label it.
- Encourage students to think about other factors that could change pH.
Teacher tip!
The discussion and reflection section can be used to evaluate the student’s knowledge.
Discussion questions
- Which household product changed the pH the most? (Think back to your control sample!)
- Did different products result in higher or lower pH readings? What do higher/lower pH readings mean?
- Given what you know about these household products, how would you describe an acid? How would you describe a base?
- How might water with high/low pH affect the organisms living in the aquatic ecosystem?
Exploring pH outdoors
Location: In the field at a local water body. For example, a puddle, stream, lake or pond!
Duration: 45 minutes
Objective: Conduct pH investigations of your local water body.
Groups: We recommend 5 students maximum per group for this activity.
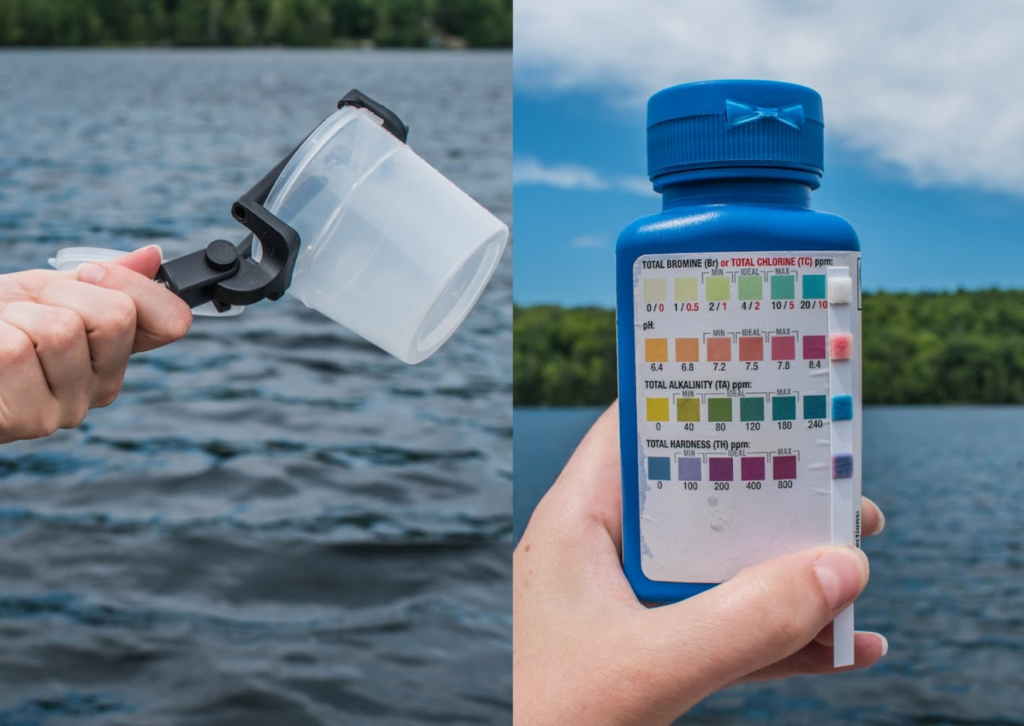
Materials needed
- Teststrips
- Sample cups (one per group)
- Reacher sticks
- Notepads and pens
Do you have your Education testkit?
All materials for outdoor activities can be found in the Water Rangers education testkit.
Education testkitAlways refer to the safety tips in your educator’s guide, as well as our testing location guide and general tips for choosing a sample location when testing outdoors.
Steps
1. Observations
- Ask students to observe their surroundings. Encourage them to mention any natural sources that could potentially influence the pH of the water. This could include rocks, soil, vegetation, or other elements.
- What do they see/notice?
- What sounds do they hear?
- What do they smell from where they stand/sit?
- Instruct students to consider the landscape and surrounding features. Are there areas with a lot of decaying vegetation? Is the soil sandy or rocky? These observations will serve as clues for predicting pH.
2. Prediction
- Based on their physical observations, have each group make predictions about the pH of the water. Do they think the environment is more likely to have acidic or basic conditions? Ask them to provide reasoning for their predictions.
3. pH testing
Suggestions for enrichment
Check out this chart of critical pH levels for aquatic organisms. Discuss why certain organisms may be more sensitive to pH changes than others and what happens to them at certain pH levels. For example, snail shells are made of calcium carbonate, and low pH will cause their shells to deteriorate. Also, low pH levels can affect fish’s gills and their ability to reproduce.
Discussion questions
How do different pH levels affect aquatic organisms?
What does this mean for the local aquatic organisms in your environment?
- Distribute note pads and pens to each group to record their measurements.
- Distribute the teststrips, reacher sticks and sample cups to each group.
- Remind students to rinse the sample cup three times and ensure their hands are dry before using the strips.
- Get students to take a sample of water using the reacher sticks and sample cups.
- Instruct them to dip the entire strip into the sampled water for 2 seconds and then wait for 20 seconds before reading the results.
- In pairs, compare the colours on the strips with the guide on the back of the container to determine the pH value.
4. Reflection and discussion
- After testing, give each group time to reflect on their predictions and compare them with the actual pH results.
- Facilitate a class discussion where groups can share their observations, predictions, and test results. Discuss any surprises or patterns noticed across different areas tested.
- For an extra challenge, you can encourage students to explore the connection between their pH observations and the potential impact on aquatic life. How might the observed pH levels influence the types of organisms that could thrive in these environments?
- When you get back to the classroom, you can record the pH of your local water body by calculating the average of students’ findings, and upload the data to our platform!
Discussion questions
- Were there any unexpected results in your pH testing?
- What are some natural causes that affect the pH of water?
- What are some human-made causes that affect the pH of water?
Ocean connections
Ocean acidification
The ocean absorbs about 30% of carbon dioxide (CO2) that is released into the atmosphere. Since the beginning of the industrial revolution, as levels of carbon dioxide have increased in the atmosphere because of human activities, the pH of surface ocean waters has decreased by 0.1. Although it doesn’t seem like much, the pH scale is logarithmic so this change means approximately a 30% increase in acidity in the ocean (NOAA). The ocean’s average pH is now around 8.1 (basic), but as the ocean continues to absorb more CO2, the pH will continue to decrease and the ocean will become more acidic.
Learn more about the chemistry and biological impacts of ocean acidificationReal world connections
Saskatchewan’s carbon sinks
Saskatchewan is known for its saline lakes, like Little Manitou, that are also known as “soda lakes”. These lakes have an alkaline pH, meaning that the lakes are basic rather than acidic. Because of the connection between pH and CO2 levels, Saskatchewan’s lakes can act as carbon sinks.
Read more about Saskatchewan’s alkaline lakes and carbon sinks in our blog post.Curriculum links
Check out our curriculum connections to see how these activities fit into the curriculum of various provinces.
Additional resources
Lesson resources
National Oceanic and Atmospheric Association (NOAA): Ocean acidification
United States Environmental Protection Agency (EPA): The effects of acid rain on ecosystems
Additional activities
ThoughtCo: How to make a red cabbage pH indicator
Try out this activity and make your own pH indicator solution using red cabbage juice! Red cabbage juice has a natural pH indicator that changes colours based on the acidity of a solution. It’s fun, simple, and a little smelly!
Glossary
Alkaline: Having a pH greater than 7, indicating a basic or non-acidic substance.
Carbon sink: A carbon sink is anything that absorbs more carbon from the atmosphere than it releases – for example, plants, the ocean and soil.
Control sample: In an experiment, a control is something that stays unchanged on purpose. It’s used as a standard to compare other results with.
Inorganic: Composed of non-living matter.
Ocean acidification: The process where the ocean absorbs carbon dioxide from the atmosphere, leading to a decrease in pH and increased acidity in the ocean. This can have negative effects on marine life and ecosystems.
Organic: Composed of living matter.