What is water quality data?
We throw around words like open data, database, and data structure a lot. But what do they really mean for our waters?
Water quality data tells the story of our waters’ health. At Water Rangers, we often like to say that each observation we take is like a snapshot in time. When we take a water quality measurement using our Water Ranger’s testkit, we are creating one “observation,” or one snapshot, that tells us something about that location at that moment. Every single observation is one piece of data.
Data is a word that gets used a lot. While it’s true that any observation or snapshot on its own is a piece of data, when we talk about our data we are often talking about data as a collection of observations — after a while, a series of snapshots starts to tell us a story.
Think of a friend who heads out to the forest for a walk. It’ll be much easier to know their route, speed, and direction by scrolling through all the pictures they took in that day rather than one single picture from a random point in time. One day’s worth of photos will tell a different story than a week’s, or a year’s.
That’s the difference between a data point (one picture), a dataset (a day, or a week’s worth of pictures), and a database (every picture on their phone). Following?
Water quality data is a collection of observations of key water test parameters. Interpreting water quality data involves integrating quality assessments, visual representation, statistics, and ecology.
In this article, we will walk through the world of aquatic data science, moving from how to read a single observation, how to understand a small dataset, and finally how to understand how databases work and their impact on water science.
Let’s jump in!
How to read an observation: one water quality data point
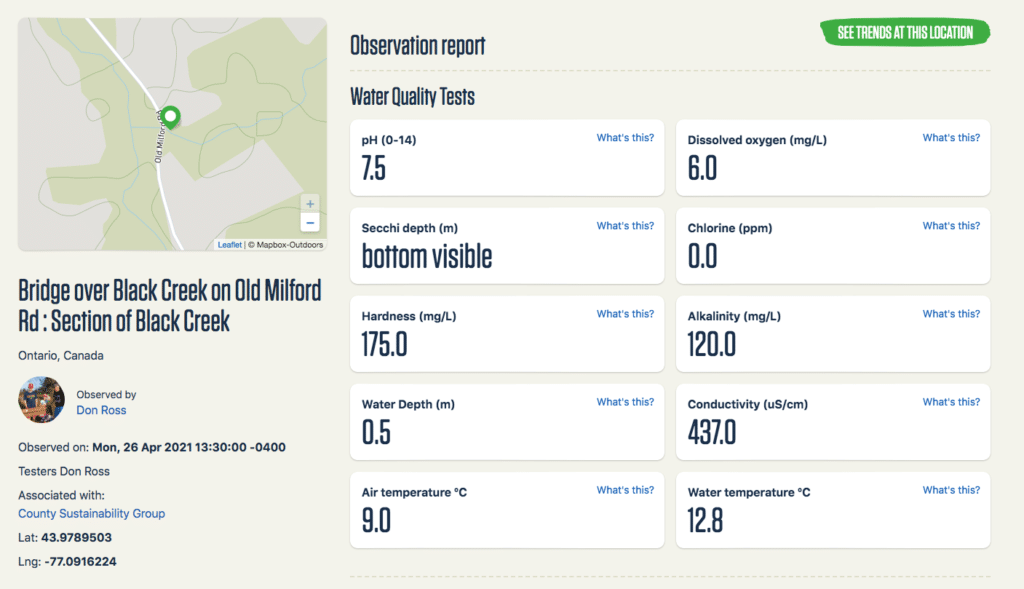
This is an observation: a snapshot of a creek near Belleville, ON on a Monday afternoon in April. This data point tells us what each parameter is measured at for a single point in time. Seeing this set of numbers on their own, we immediately think of some questions: is our water looking healthy? Are these values ‘correct’?
To understand a single observation, we need to know what we are looking at. Review each parameter to remember why it is important and what part of the aquatic ecosystem it represents. From this ecological point of view, we will be able to make some predictions about this site, even from a single snapshot. For example, we can think about what kind of organisms may be thriving in this cold, early spring water, and which organisms we may not see until the water warms up.
However, to answer the bigger questions of water quality, and how this water might change over time, we need more than just a snapshot.
How to read location summaries: small water quality datasets
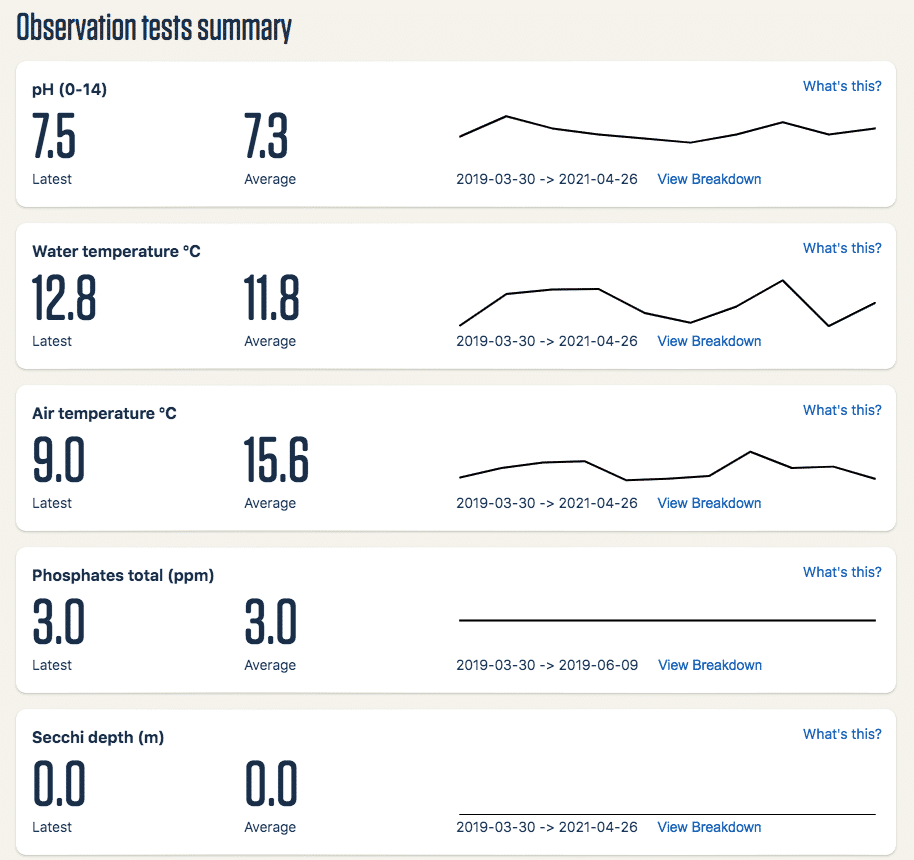
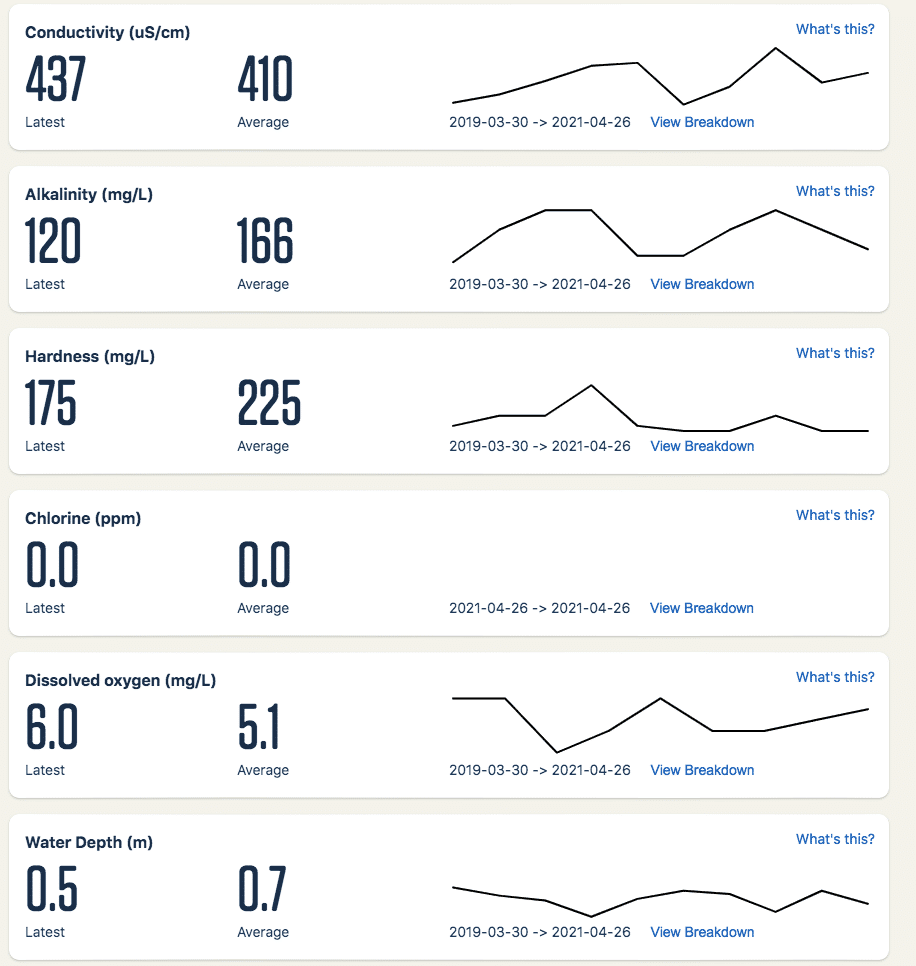
These thirteen observations — a record of all the observations taken at the same location as above between 2019 and 2021 — form a series of snapshots of the creek’s health. Putting it all together, we are able to see a story of how our creek is changing and what measurements we might expect to see if we head out for a test. This is a small dataset: a series of data points you can interpret all together to answer bigger questions than you can with one measurement alone.
Datasets are often shown visually in a line graph (as above) or in a depth chart (for monitoring at depth). For example, look at temperature — reading the single observation, we figured our water was quite cold. Actually, this temperature is above average for this section of creek, and a standard value to be seeing at this point in the spring. The chart shows that the temperature will likely slightly rise to around 20 degrees and then cycle back down!
Is this just a cold creek, or do other creeks in the area have similar temperature profiles? Again, we will need more information — and more data! — to understand these bigger questions.
How to read the Water Rangers map: an entire database
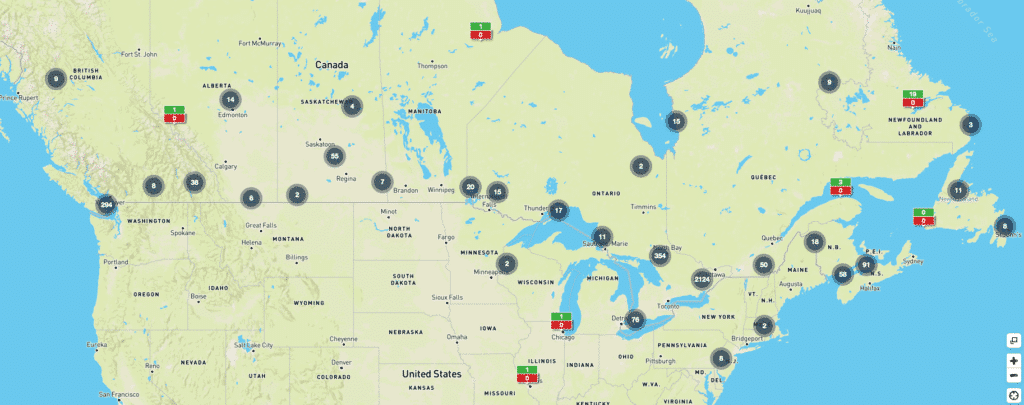
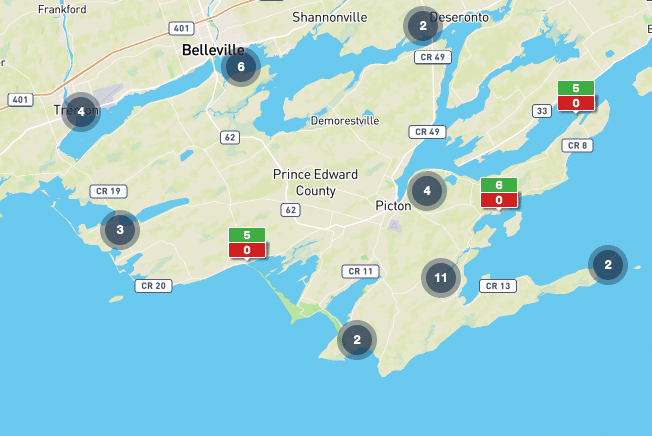
Now, what if we were able to compare our thirteen creek measurements to every creek in the region? How about every creek in the country? A large water quality database — a collection of water quality observations over time for many different locations — allows us to answer some even bigger questions about our water quality.
For example, in the case of our cold water creek, we can see how its temperature patterns compare to other creeks in the area. Creeks that have lower water temperatures than surrounding creeks are important to protect as spawning habitat for trout, lampreys, and other species at risk!
A large water quality database also allows us to monitor how our water systems react to large weather events, pollution effects, and we can watch and respond in almost real time as effects ripple across the system. Look how much our view and understanding of the creek’s ‘story’ expanded when we moved from one to thirteen observations. Now how about 20 000 — or more?
Water Rangers is working to build the largest, easiest to access, and most complete database of community based water monitoring not only across Canada, but across the world. Right now, people are using our website in more than 20 different countries, but we consider this just the beginning! Imagine what we could ask — and answer — with the kind of complete monitoring coverage we aim to build. With a steward in every single watershed monitoring and taking action on behalf of our waters, we will change the future of freshwater in Canada and how it is understood.
Learn more! Resources and other databases
It is important to note that we are not the only water quality database available! Using your new skills, you can explore water monitoring databases compiled by the Government of Ontario, Environment and Climate Change Canada, as well as our partners at DataStream, who are building the most comprehensive database of Canadian water quality ever created. We play a role in assisting them by providing a source of community compiled data!
Exploring other data sources will help you dive deeper into understanding data structures and piecing together the stories our waters tell. Many of these sites have advanced features for dataset analysis, including spatial delineation and statistical analysis. Check it out!
Learn more about interpreting water quality data by diving into these publications and guides.